Monday, April 27, 2015

Python Split() Function

Splitsville

One of the most common things I do in GIS scripting is parsing data from one field to two fields or from an output delimited text file from some other data storage system to a usable CSV or delimited text file that I can import into GIS format.  Enter the split function.  I use the split function almost as much as Harry Potter uses the Expelliarmus charm.

It's fairly simple and crazy useful.  You can use it in a stand alone script or in the field calculator.  The syntax is like this:

'string'.split('delimiter', Max) or stringVariable.split('delimeter', Max)

The function returns a list with elements that result from the split.  Both of the parameters are optional.  The  'delimiter' parameter is what you want to use as the delimiter for the string.  If left out the function uses any whitespace as the delimiter (spaces, tabs, newlines).  The Max parameter is the maximum number of times you want the function to perform the split.

So if we want to split a ZIP code in this format '12345-6789' into its component parts you could use:

myZip = '12345-6789'
zipComponents = myZip.split('-') #output is a list
zip5 = zipComponents[0]
zip4 = zipComponents[1]

You could accomplish the above with less code using string slicing but that's for another post.

The Max parameter is a bit misleading - if I specify a maximum split parameter the list doesn't just contain that many elements, it actually has two valid elements and a third element with the remainder of the string.  So if I run the following:

testString = '1-2-3-4-5'
testList = testString.split('-', 2)

The result would be:

['1', '2', '3-4-5']

I use the split function to parse a pipe ('|') delimited text file to drop unneeded elements and split elements I want in separate fields.  Very useful.

Good luck with using the split function.  I use it all the time with very satisfactory results.  EXPELLIARMUS!

And any Python gurus who would like to comment and make the above code more python-y, please do, I'm always trying to become less of a hack.


Saturday, September 20, 2014

Get python.exe to be Recognized by the Command Window

Tired of this error?
'python' is not recognized as an internal or external command, operable program or batch file.

It is often handy to run a python script from the windows command window, but it is a bit cumbersome to have to type in C:\python27\ArcGIS10.2\python.exe pythonScript.py every time.  Here's how you get python as a recognized executable in the command window.

Path - System Environment Variable

Windows looks for executable files in a semicolon delimited list of directories stored in the Path system variable.

To add python to this list - click Start - and type "system variables" in the search input at the bottom.  There should be a result for "Edit the system environment variables".  You can also get there from the Control Panel - System - Advanced System Settings.

This brings up the System Properties dialog.  From this dialog click the "Environment Variables" button.  Under "System Variables", scroll down until you find the Path variable - click on it and click Edit...  In the "Variable value:" box, find the end of the text and add a semicolon (;), then add the path to your python.exe file (usually in C:\Python[version number]\ArcGIS[version number]\ - at the time of this writing it would be C:\Python27\ArcGIS10.2\).  Now click OK on each of the open dialogs.  Python will now execute from the command window no matter where you are in your directory structure.

Notes

If you have a command window open at the time you change the variable, that command window still won't recognize the python command.  You need to close the command window and open another one.

Each time you upgrade your version of ArcGIS for Desktop, the location of the python executable may change - it may become something like - C:\Python32\ArcGIS10.3, so you need to modify your path variable again.


Monday, March 3, 2014

Creating a Tile Package and Publishing it on ArcGIS Online

Publishing ArcGIS Online Tile Packages


I have been working with a small city to get an ArcGIS Online solution up and running.  I had watched one of the hour long Esri web seminars that showed it was possible to create and publish a tiled service without burning any credits.  One of the great things is you don't need ArcGIS for Server, just ArcGIS for Desktop and an ArcGIS Online for Organizations subscription.  Being able to publish one of the Local Government Basemaps as a cached service without using any credits is ideal for a small city.

Author the Map, or Use a Local Government Template


The first step is to author your map, following all of the guidelines for efficient web maps such as grouped layers that turn on and off at the standard Esri/Google/Bing scale levels.  I published the general basemap template from the Local Government community on the Esri solutions site.

Change the data source.


If you use one of the templates, you need to change a few things.  First of all, you need to point the map to your copy of the Local Government Information Model.  I do this by changing the name of the file geodatabase the template is pointing to, then open my copy of the template and click on one of the red exclamation marks and point the map to the corresponding layer in my LGIM geodatabase.  ArcMap then fills in all of the other layers that are in your LGIM geodatabase.

Change the full extent of the data frame.


You are probably going to need to zoom to your
Set the full extent of the data frame.
Set the full extent for the data frame.
data's extent - right click on one of your layers and choose Zoom To Layer.  Then zoom the map to the extent you want to be the default extent of your online service.  Next you need to change what ArcMap uses as the full extent for your data frame, in the templates Esri has this set to a specified extent around the sample data.  Open the Data Frame Properties window by double clicking the data frame name ("Layers" in the templates). Go to the Data Frame tab and in the Extent Used By Full Extent Command area, choose the "Other" radio button, then click on the "Specify Extent" button. In the Full Extent dialog select the Current Visible Extent radio button and click OK.  While you are in the Data Frame Properties dialog make sure the No Clipping option is selected in the Clip Options area.  I have  read on forums that maps
Choose "Current Visible Extent"
Choose - "Current Visible Extent".
don't publish well if they are clipped to the shape of a layer or a custom extent.  Click OK on the Data Frame Properties dialog.  You can make sure the full extent works by zooming the map to another scale or area then click the full extent button (globe button) on the standard toolbar.  This will ensure that the "Zoom To" option in an ArcGIS Online map functions properly, it will also allow your service to show up in spatial searches in ArcGIS Online.

You will also want to change some of the items in the Map Document Properties dialog.  Go to File - Map Document Properties and add and change any necessary information.  I usually leave the Author as Esri, Inc because they did author the map.  I change the credits to by my firm, the city I am working for and Esri Inc. I leave the title, summary and description as they are with the original template.

Share as a tile package.


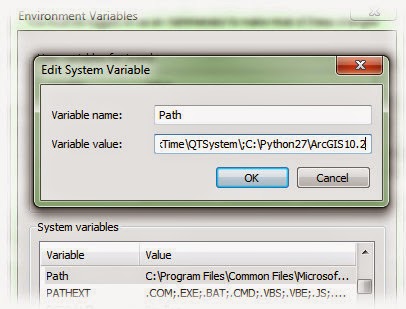
The next step is to share your map as a layer package.  This takes your map and creates tile images of the map at the standard ArcGIS Online/Google/Bing scale levels.  This is why you set up your map to draw and label layers certain ways when it is drawn at specific scales.  To accomplish this you need to first make sure you are signed on to your ArcGIS Online account in ArcMap, this will require an ArcGIS Online for Organizations subscription.  Go to File - Sign In and enter your ArcGIS Online username and password.  It is also advisable to check the Remember Me, Remember My Password and Sign Me In Automatically check boxes.  I have read in the forums that large tile packages may time out if these boxes are not checked. You can click on the Forget Me link later after the tile package is uploaded to ArcGIS Online.  To create the tile package and upload it to ArcGIS Online, go to File - Share As - Tile Package... If Tile Package is not among your choices you need to first enable ArcGIS run-time tools in the ArcMap Options dialog.  To do this go to Customize - ArcMap Options... then go to the Sharing tab.  In the Packaging section, check the "Enable ArcGIS Runtime Tools" check box.

Tile Package Wizard


Now Tile Package should be a choice in the "Share As" File Menu list.  After choosing to share the map as a tile package, you should see the Tile Package wizard.  In the Tile Package selection on the left choose
Tile Package Wizard
Tile Package Wizard
"Upload package to my ArcGIS Online account". And give the package a name. I have tried both of the options on this page, and the first option is easiest.  You can choose the "Save package to file" and then use the "Share Package" tool in the Data Management toolbox in the Package tool set, but the first option does both for you.  I may have read that large packages may need to use the second option, but I would try to upload it directly first.

In the Tile Format section of the wizard, leave everything as the default *except* the Tile Format choice. I tried and tried to use the default PNG choice but every time had something go wrong. I finally had partial success using the MIXED choice,
Tile Format Page
Tile Format Page
but I think this choice is for raster data.  My basemaps had both raster and vector data.  I found PNG32 to work the best for the basemaps.  Since that choice worked for me, I didn't try any of the other choices besides the default and MIXED.  If you don't want your map to be drawn at the highest scale level, adjust the slider to the desired level.  A little picture shows you what an example of the highest level you have selected would be.  I leave it to create tiles at all scale levels because I am dealing with a small geographic area for a city.

The Item Description options should already be filled out for you.  The wizard takes these items from the ArcMap Document Properties information you filled out earlier.  You can choose to share your tile package in your organization on the Sharing page of the wizard, but I leave this page alone because I am going to publish the package later in ArcGIS Online.  If you want to, click Analyze at the top to analyze your map for online display. This is actually done for you if you click Share, so I just click the Share button. If there are any errors, you need to fix those, the wizard won't continue until they are fixed. If there are warnings about performance or display speed, you can forget about those, it may take longer for your tiles to be generated, but it won't affect performance in the online map because it is accessing your tiles not a map service.

ArcMap will start generating tiles and give you a progress window telling you which scale level it is currently working on.  Once tiles are generated, the progress dialog changes to tell you it is uploading the package to ArcGIS Online with an estimate of how much time is left.  ArcMap will tell you that it has successfully created the tile package and uploaded it to ArcGIS Online.

Publish the tile package on ArcGIS Online.


Now use your browser to go to ArcGIS Online.  Log in to your organization account.  You will need Publisher permissions to publish your tile package. Go to the My Content page and select your tile package title in the list. This will open a page with the details of the tile package with some options along the top.  One of the options is Publish.  Click Publish and you will be asked for a name for you map service.  After entering a name, enter at least one tag, but add anything that you think describes the data and will help people find it. After you click Publish, you will see a few progress statements then you will be taken to your new service's description page. The thumbnail of the service should start showing that it is publishing tiles, and you can see a percentage of the tiles published on the Tiles line of the Publishing section.  Once 100% of the tiles are published, you can add the service to an ArcGIS Online map, you can add it to an ArcGIS Desktop map, or you can use the link under Map Contents to configure Local Government apps.


Other Considerations


After publishing your tile package, you can share the service with groups in your organization, or share it with everyone.  When you share it with everyone, your service will turn up in spatial searches and keyword searches for ArcGIS Online users.

You will be charged credits for the amount of disk space your tile package and service use.  The rate is 1.2 credits per gigabyte of storage per month.  Here is a link showing what will cost you credits on ArcGIS Online.  You may be able to delete tile package that you uploaded after you have published it to reduce your storage credit usage, and this may be where you want to save the tile package locally and upload it with the Share Package tool.  I may try that workflow and comment about the results.

Wednesday, November 27, 2013

Finding Lakeview Lots

I was just asked by an appraiser to make a map of a subdivision so that he could determine which lots have a view of a nearby reservoir.  This area was affected by the Rockport 5 Fire in August of 2013, so a re-appraisal is in order to assess the effects on properties in the area.

Rather than just make a map, I thought I could do some view-shed analysis to select the lots that have a view of the reservoir.

Observer Points

I started out by creating a fishnet grid of the reservoir with the label points option checked.  I used the resulting label points as my observer points for the viewshed tool in the 3D Analyst toolbox.  I exported the reservoir to a stand-alone feature class, then ran the fishnet tool using that feature class as my extent template.  On my first attempt I used a 40' x 40' grid, but I found this was too small - creating thousands of observer points.  My next attempt I used 300' x 300' and that resulted in a little over 500 observer points.
Create Fishnet Results
Points and polygons from Create Fishnet tool.
I then had to get rid of the points outside of the reservoir boundaries.  I did this by selecting the points that intersected with the reservoir, then switch the selection and deleted the selected points.

Smaller DEM

I didn't want to do viewshed analysis for the entire DEM, so I used the Extract by Mask tool in the Spatial Analyst - Extract toolbox.  For the mask, I just created a simple rectangle polygon in a stand-alone feature class.


Viewshed

I used the smaller DEM raster and the label points for input to the viewshed tool.  It took several minutes to process the viewshed even with a smaller DEM.  It would probably be faster with fewer observation points.  The result is another raster with two columns of data.  The VALUE field has the number of observer points visible from that cell.  The COUNT field has the number of cells that can also see that many observer points.

I converted the visibility raster to polygon features and deleted the polygons with a GRIDCODE of 0.  Then I selected the properties within the desired subdivisions that intersected the visibility polygons.  Then unselected those that just touched on the edge, or had the majority of the lot that wasn't inside the visibility layer.

Final Map

The final map showed the subdivisions color coded by each of the phases, the locations of existing buildings, the locations of buildings that burned in the fire, the fire perimeter, and the visibility raster.  All overlayed on recent aerial imagery.  I also created a spreadsheet of lots that were considered view lots.

Friday, November 22, 2013

X Ray for ArcCatalog - How Does That "Use Spatial Reference" Option Work?

X Ray for ArcCatalog

In my quest to implement the Local Government Information Model, I have struggled with the X Ray for AcrCatalog add-in.  The add-in takes an xml document defining the schema of a geodatabase and applies it to an empty file geodatabase.  It does a bunch of other stuff, but that is the only thing I wanted to use it for.

I got hung up on the needed step of changing the spatial reference before applying the xml schema to my geodatabase.  If I would have followed the steps here I would have not struggled at all.  I also found this video by Heather Eisan from Esri very helpful:


For some reason, I got as far as downloading and installing the add-in, but then got stuck because I was using the help document for X Ray under the X Ray Help menu to set the spatial reference:


I followed those steps again and again with no change.  The steps I should have followed are:
  1. Select the Local Government xml file in the contents window of ArcCatalog.
  2. Open the xml document in X Ray by clicking on the folder with an x on it- , or use the Open XML Workspace  choice in the X Ray menu on the X Ray window.
  3. Select a feature dataset or feature class with the desired spatial reference in the contents window in ArcCatalog.
  4. Select the Use Spatial Reference choice in the Options menu on the X Ray window.
  5. Click the save button or the Save choice from the X Ray menu on the X Ray window.
  6. Select the empty file geodatabase you want to apply the schema to in the contents window of ArcCatalog.
  7. Click the Import XML Workspace to selected GDB button, or the Import to Geodatabse choice in the X-Ray menu.
I was missing those two very important steps in bold print above.

You can actually skip X Ray altogether by editing the xml document in Notepad++ or some other xml editor.  You can search for the <WKT> tags and replace the text between them with text from another xml document you create by right clicking on a feature dataset or feature class and choosing Export - XML Workspace Document, making sure you select the schema only option.

After successfully importing the schema into your LGIM geodatabase, you can then use another set of custom tools written in python called Gizinta, (written by the same developer that wrote X-Ray) that also uses xml files to port your existing data into your LGIM geodatabase.  But that is for a future post.

Thursday, November 21, 2013

Upgrade Heartache

Upgrade Delay

I used to upgrade my version of ArcGIS for Desktop as soon as the box of media was delivered.  But ever since Esri started making the media available for download and shipped only by request, I have become a bit slower to implement the upgrade.  One of the reasons being the servers Esri uses are very slow, and another being it took half the day to uninstall the old version and install the new one.  I usually look through the new features and if there is something to make it worthwhile I will upgrade sooner rather than later.

With 10.2, I haven't been too eager for the upgrade - partly because of the very difficult time I had getting ArcGIS for Server back to an operational state after the last upgrade.  I finally bit the bullet today and upgraded from 10.1 to 10.2, if only to use the 10.2 version of the Local Government Information Model.  After doing the upgrade, I realized another reason why I delay the upgrade - all of my customizations of the interface are discarded with the new version.  

Getting Back What Once Was Mine

So if you like your toolbars where they are, and you don't want to rebuild ArcMap to the way you are used to using it, you need to copy some files from your 10.1 installation folders to the 10.2 folders.

Normal.mxt

All of your toolbar placements and other customizations like keyboard shortcuts etc. are stored in your Normal.mxt template.  The 10.1 version of the file is located at:

C:\Users\<YourUsername>\AppData\Roaming\ESRI\Desktop10.1\ArcMap\Templates\Normal.mxt

Just copy that file and paste it into:

C:\Users\<YourUsername>\AppData\Roaming\ESRI\Desktop10.2\ArcMap\Templates\

Don't worry about keeping the Normal.mxt that is already in that folder, just pick the replace option when you paste it in there, that file is set to the install defaults and you don't want it.

If you can't find an AppData folder, your system is hiding system folders and files.  Go here to learn how to make Windows show them.

Toolboxes

If you have created any custom toolboxes with models, scripts or geoprocessing tools in them, you can copy those over as well.  Toolboxes are located at:

C:\Users\<YourUsername>\AppData\Roaming\ESRI\Desktop10.1\ArcToolbox\My Toolboxes

Just copy those files to:

C:\Users\<YourUsername>\AppData\Roaming\ESRI\Desktop10.2\ArcToolbox\My Toolboxes

Styles

Style files are created when you create your own color ramps, symbols etc.  These files have a .style extension and they live at:

C:\Users\<YourUsername>\AppData\Roaming\ESRI\Desktop10.1\ArcMap\

So put them in:

C:\Users\<YourUsername>\AppData\Roaming\ESRI\Desktop10.2\ArcMap\

Others

You can probably figure out the rest by browsing the folders in the Desktop10.1 directory.  There may be a folder like Coordinate Systems.  This folder has any coordinate systems you selected as favorites.  There is a Templates folder.  This folder stores, of all things - templates you have created.  There are also folders for ArcCatalog and Locators in the Desktop10.1 folder.


Get On the Stick, Esri

Copying these files over with every upgrade is a bit of a pain and, if you are like me, you forget where the files are located every time you do an upgrade and have to search for their location.  I'm surprised there isn't a part of the install package that searches for these types of files and asks if you would like to have the install copy them over.  How hard would that be Esri?